

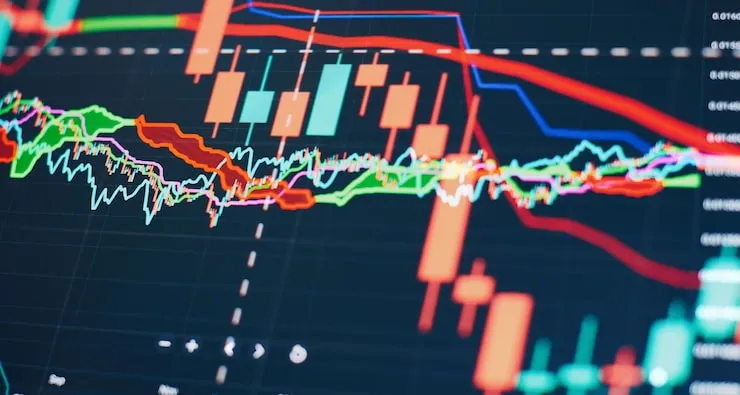
This discussion looks at these important technical signs that define the price movement of Bitcoin at the beginning of 2026. The aggregate market structure has bearish pressure prevailing in both short and medium-term periods. The major resistance lies at the level close to 93,000 and analysts are concerned about possible drops to the support zone between 76,000 and 87,500.
The overall recommendation of top technical tools indicates Strong Sell or negative rating, which indicates that the traders should exercise caution given the prevailing climate.
The table below highlights the important signals of major technical indicator classes:
| Indicator Category | Overall Signal | Key Detail | What It Suggests |
|---|---|---|---|
| Moving Averages | Strong Sell | 12 out of 12 major MAs show Sell signals. | The price is below its average levels, indicating a downtrend. |
| Oscillators (RSI, Stochastic, etc.) | Strong Sell | RSI at 41.1; multiple oscillators in Sell territory. | Momentum is bearish; the asset is neither oversold nor overbought. |
| Market Structure | Negative | Price is struggling below key resistance at $93,000. | The path of least resistance is currently down unless resistance breaks. |
| Medium-Term Forecast | Negative | Investtech score: -63. The trend is rated negative for 1-6 months. | The bearish pressure is expected to persist in the medium term. |
Decoding the Tools: A Guide to Key Technical Indicators
Technical analysis involves the application of math and charts to identify trends. Imagine a weather map before traveling. It does not tell you what will happen, but it would be ready. These are the key technical analysis tools traders can use to analyse Bitcoin today.
The Role of Moving Averages in Trend Identification
One of the simplest and the strongest tools are Moving Averages (MAs). They filter the price chart that is noisy to indicate the direction of the underlying trend.
- Simple vs. Exponential: In a Simple Moving Average (SMA) all the prices in the period are accorded equal weight. An Exponential Moving Average (EMA) is a more responsive moving average since more emphasis is placed on the latest prices.
- Current Signal: Bitcoin is now below virtually all of its major moving averages, both the short term (such as the MA5) and the long term (such as the MA200). A market with a price that is lower than these averages is a standard bearish market trend. This high sell signal by MAs is a great contributor to the pessimistic attitude.
You may also read :- Bitcoin Chart Analysis for Traders and Investors
Momentum Gauges: RSI and Stochastic Oscillators
Oscillators can make us know how fast and powerful a price movement is. They inform us whether or not an asset could be exhausted by a frenzy or a fall.
- Relative Strength Index (RSI): The oscillator is between 0 and 100. Historically, when the reading of an asset is over 70, it is regarded as overbought (and therefore could be pulling back) and a reading of below 30 indicates oversold (and therefore could be bouncing). The RSI of Bitcoin is approximately 41.1 that is neutral with a bearish trend.
- Stochastic Oscillator: Like RSI it determines overbought and oversold markets. Values (above 80) are overbought and values (below 20) are oversold. One of the Stochastic readings is at present very high (98.86) indicating an overbought in the short run and the other is low (30.11). These contra-indications may occur in unstable times and may indicate uncertainty on the market.
Advanced Tools: MACD and the Ichimoku Cloud
Traders employ more intricate indicators to have a closer look.
- Moving Average Convergence Divergence (MACD): The instrument displays the correlation between two EMAs. A downward MACD such as the current value of -155.96 of Bitcoin indicates a weak short-term trend compared to the long-term trend, a bearish indicator.
- Ichimoku Cloud: is a Japanese indicator that is an all-in-one indicator that displays support/resistance, momentum, and trend direction simultaneously. Although the detailed description of such comprehensive tools is not provided in the current data, it is crucial to prove the signals provided by less complex indicators.
Bitcoin Technical Analysis Today: Interpreting Market Structure and Sentiment

In addition to the personal signs, the analysts examine the general market structure and psychology. Patterns are the movements of prices and the reaction to some levels.
Critical Support and Resistance Levels
The price charts tend to respect certain levels.
- Resistance: This is the point in which the selling pressure has been strong historically. In the case of Bitcoin, the key resistance ceiling to monitor is 93000 dollars. Any break higher than this may turn the negative perspective around.
- Support: It is a price level that the buying pressure is likely to show. It is observed to find current vulnerable support between $87, 500 and 89, 000. In case they are broken, the next major target of analysts such as Roman is at a point of 76,000.
- Pivot Points: This is computed support and resistance to the trading day. The pivot point of day is now considered to be at the classic level of $90,084.51 and the levels of resistance are piled up above the pivot point.
The Weight of Market Sentiment and Analyst Outlooks
A strong force is the mood of the market. The bearishness is currently experienced because Bitcoin is not maintaining its early 2026 recovery.
- Analyst Warning: Keith Alan of Material Indicators writes about an emerging bearish Death Cross pattern of weekly charts. According to him, a price rally is to be considered as selling opportunities in the meantime.
- The Need to Have a Solid Bottom: Analyst Daan Crypto Trades reasons that to have a sustainable rebound, the market may have to experience a fall that is below the level of January to have a dependable bottom. It will imply that the current downwards trend might not be finished.
Looking Ahead: Price Forecasts and Strategic Considerations for 2026
Where is Bitcoin headed? There is disagreement among analysts and they cite major causes.
Expert Price Predictions and Macro Drivers
The 2026 prediction is a war of bulls and bears.
- Bear Case: Bloomberg’s Mike McGlone has cautioned that Bitcoin may even slump back to levels as low as $50,000 as the risky asset market broadly goes through normalization.
- Bull Case: Support has reasons to other people such as Fabian Dori of Sygnum Bank. He cites a rise in economic indicators and the possible positive regulatory clarity presented by such legislation as the U.S. Clarity Act.
- Scenario: Consolidation Bitfinex analysts project that the Q1 2026 will be a consolidation period with the Bitcoin trading within a range as the market cleanses itself of the recent volatility.
Building a Smart Trading Plan
Technical analysis is a guide, not a crystal ball. Here’s how to use it wisely:
-
Never Rely on One Signal: Always look for confluence—where multiple indicators (like MAs, RSI, and market structure) all point to the same conclusion.
-
Manage Your Risk: The market is volatile. Only risk a small percentage of your capital on any single trade.
-
Use Stop-Loss Orders: Always know in advance the price at which you'll admit a trade idea was wrong. Placing a stop-loss order below a key support level (like those from Fibonacci retracement levels) is a common strategy.
-
Watch the Big Picture: Incorporate news and market sentiment. For example, tools tracking search trends for terms like "buy Bitcoin" can provide real-time insight into retail trader interest.
Frequently Asked Questions
From a technical analysis perspective, is Bitcoin a buy or sell today?
Based on the aggregation of moving averages and oscillators, the daily technical signal for Bitcoin is a "Strong Sell" or "Negative." Major platforms like Investing.com show 12 out of 12 moving averages giving a sell signal, and key momentum indicators are bearish.
What is the most important level for Bitcoin to watch right now?
The key resistance level is $93,000. A decisive break above this ceiling could signal a shift in market structure. On the downside, the $87,500 to $89,000 zone is critical support; a break below it could open the path toward $76,000.
What does the RSI tell us about Bitcoin's current condition?
Bitcoin's 14-day RSI is approximately 41.1. This is in the neutral zone (between 30 and 70) but leans toward bearish momentum. It suggests the asset is not yet oversold, meaning there could be more room for the price to decline before reaching a typical bounce area.
How reliable is technical analysis for predicting Bitcoin's price?
Technical analysis is a study of probabilities, not certainties. It is a valuable tool for identifying trends, momentum, and key levels, but it should never be used alone. It is most effective when combined with sound risk management, an understanding of market news, and other forms of analysis. Always remember that past performance does not guarantee future results.