

I remember my first time looking at a Bitcoin price chart. Red and green candles everywhere. Lines going up and down. I had no clue what any of it meant. Sound familiar? You are not alone. Most people feel lost when they first try to understand bitcoin. But here is the truth: learning to read the chart changes everything. You stop guessing. You start making smarter choices.
What Is Bitcoin Technical Analysis?
Bitcoin technical analysis is simply a way to study past price moves and trading volume to guess where the price might go next. You do not need to know what Bitcoin is under the hood. You do not care about news or Elon Musk tweets. You only care about the chart. Think of it like reading footprints in the snow. The price leaves marks behind. Those marks tell a story. Your job is to read that story.
With bitcoin, you look for patterns. You watch for support levels where price bounces up. You watch for resistance levels where price hits a ceiling and drops. You use tools like moving averages and RSI to confirm what your eyes see. I use technical analysis every single day. It keeps me calm when the market goes crazy. It gives me rules to follow instead of emotions.
You may also read :- Bitcoin Chart Analysis for Traders and Investors
The Bitcoin Analysis Chart : Your Map
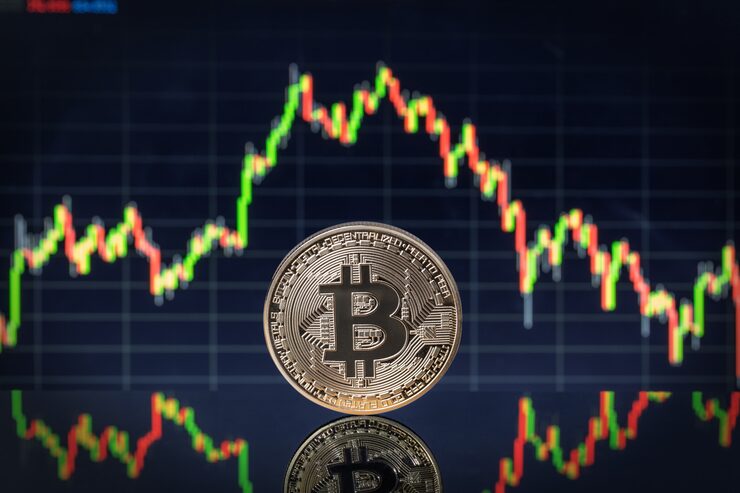
The bitcoin analysis chart is your best friend. Without it, you are driving blind. With it, you have a map of where price has been and where it might go next.
Here is what you will see on any bitcoin analysis chart:
-
Candles – Each candle shows the opening price, closing price, high, and low for a period of time (like 1 hour or 1 day). Green candles mean price went up. Red candles mean price went down.
-
Trend lines – A line that connects higher lows (uptrend) or lower highs (downtrend). The trend is your friend until it bends.
-
Support – A price level where buyers keep stepping in. Price stops falling and bounces up.
-
Resistance – A price level where sellers keep showing up. Price stops rising and drops down.
-
Moving averages – Lines that smooth out price noise. The 50-day and 200-day moving averages are very popular.
I spend at least 30 minutes each morning looking at the bitcoin analysis chart before I make any move. It saves me from stupid mistakes.
Why Most People Fail at Reading the Chart
They look at too many things at once. They jump from one indicator to another. They get confused and give up.
Here is my simple rule – pick three tools and master them. I use:
-
Support and resistance levels
-
50-day moving average
-
RSI (Relative Strength Index) to see if Bitcoin is overbought or oversold
That is it. You do not need twenty indicators.
Bitcoin Analysis and Prediction for 2026

Now let us talk about bitcoin analysis and prediction for the year 2026. I will share what I see on the chart. Remember – no prediction is 100% sure. But we can make educated guesses based on history.
Bitcoin moves in cycles. About every four years, we get a “halving” event where the reward for mining Bitcoin gets cut in half. The last halving happened in April 2024. History shows that price usually goes up a lot in the 12 to 18 months after a halving.
We are now in 2026. The big post-halving rally already happened in 2024 and 2025. So where does that leave us?
Looking at my bitcoin analysis and prediction, I see three possible scenarios:
Scenario 1 – The Bull Continues
- If institutional money keeps flowing in
- If global economic uncertainty pushes people to Bitcoin
- Price could reach $71,000 to $100,000 in 2026
Scenario 2 – The Sideways Market
- Price goes up and down in a wide range
- No clear direction for months
- Range between $70,000 and $120,000
Scenario 3 – The Bear Market
- We enter the “crypto winter” phase
- Price drops slowly over many months
- Possible low of $45,000 to $55,000
Which one will happen? I cannot say for sure. But my bitcoin analysis and prediction leans toward scenario 2 for the first half of 2026, then scenario 3 in the second half. Why? Because Bitcoin tops out roughly 12-18 months after halving. That puts the top in late 2025. Then we usually see a long drop.
But do not take my word for it. Do your own bitcoin analysis and prediction using the chart.
Bitcoin Price 2026 – What the Numbers Say
For Bitcoin price analysis in 2026, key levels are based on market structure and projections. The $71,000 level is considered a potential resistance zone, where traders may take profits if bullish momentum continues.
Why? Because every Bitcoin cycle follows the same pattern. Hype drives price up. Then excitement fades. Price falls. Then the cycle repeats.
BTCUSD Buy or Sell

This is the question everyone wants answered. BTCUSD buy or sell I will not give you a direct answer because that would be irresponsible. But I will teach you exactly how to decide for yourself.
Here is a simple checklist I use every morning to decide BTCUSD buy or sell :
Signals to BUY (look for these):
- Price bounces off a strong support level (like $70,000 or $85,000)
- RSI below 30 (oversold) and starting to turn up
- Price above the 50-day moving average
- Higher lows forming on the daily chart
- Green candles with long bodies and short wicks
Signals to SELL (look for these):
- Price hits resistance (like $125,000) and forms a red candle
- RSI above 70 (overbought) and starting to turn down
- Price below the 50-day moving average
- Lower highs forming on the daily chart
- Red candles with long bodies and short wicks
How to Start Doing Your Own Bitcoin Technical Analysis
You do not need expensive software or a finance degree. Here is how I started and how you can start today:
Step 1 – Pick a free charting website
- TradingView is the best. Free account gives you everything you need.
- CoinMarketCap and CoinGecko also have basic charts.
Step 2 – Set up your chart
- Choose daily candles (each candle = one day)
- Add the 50-day and 200-day moving averages
- Add RSI at the bottom
Step 3 – Draw support and resistance
- Look for price levels that touched multiple times
- Draw horizontal lines at those levels
- Update these lines every week
Step 4 – Practice on old data
- Go back to 2022, 2023, 2024
- Look at the chart and say “I would buy here” or “I would sell here”
- See if you were right
Step 5 – Start small with real money
- Only use money you can lose
- Make tiny trades to test your skills
- Keep a journal of every trade and why you made it
Common Mistakes to Avoid
- Looking at the 1-minute or 5-minute chart – too much noise. Stick to daily or 4-hour.
- Changing your plan every time price moves – stick to your levels.
- Ignoring the trend – do not fight the trend. If daily chart is down, do not buy.
- Using too many indicators – keep it simple.
FAQ
Q1: Is bitcoin analysis accurate for predicting price?
No method is 100% accurate. Bitcoin analysis gives you probabilities, not guarantees. It helps you make better decisions, but you will be wrong sometimes. That is normal. Use stop losses to protect yourself.
Q2: Do I need to buy expensive tools for analysis chart?
No. Free websites like TradingView give you everything you need. The analysis chart on TradingView has all the indicators, drawing tools, and timeframes you will ever use.
Q3: What is the best timeframe for bitcoin analysis and prediction?
For bitcoin analysis and prediction, I use daily candles for the big picture and 4-hour candles for entry and exit points. Avoid 1-minute or 5-minute charts – they will drive you crazy.
Q4: Can I do bitcoin analysis and prediction without any experience?
Yes. Start by watching the chart for 15 minutes every day. Look at how price moves between support and resistance. After a few weeks, you will start seeing patterns. That is how I learned.
Q5: What is the most reliable indicator for bitcoin analysis?
Support and resistance levels. They work better than any fancy indicator. After that, the 50-day moving average and RSI are my favorites.
Final Thoughts
Bitcoin technical analysis changed the way I trade. I stopped guessing. I stopped panicking. I started following the chart. The bitcoin technical analysis chart tells you everything you need to know. You just have to learn how to listen. Support, resistance, moving averages, RSI – that is really all you need.
For bitcoin analysis and prediction in 2026, expect a range-bound market with a possible drop in the second half. For bitcoin price 2026, watch $70,000 and $125,000 as the most important levels.
I cannot tell you what to do with your money. But I can promise you this—if you learn Bitcoin, you will make fewer emotional mistakes. And that alone puts you ahead of most people in this game